Seven steps toward utilizing prognostic data analysis to optimize maintenance schedules.
Traditionally, availability forecasts and remaining useful life (RUL) estimations have been based on expert assessments of technical risks and a certain degree of intuition from personal experience with assets. This inside understanding is invaluable. Yet, especially in industries in which downtime is extremely costly new solutions are demanded to assess future risks. Most assets have data readily available – why not using this data to objectively support an expert’s experience?
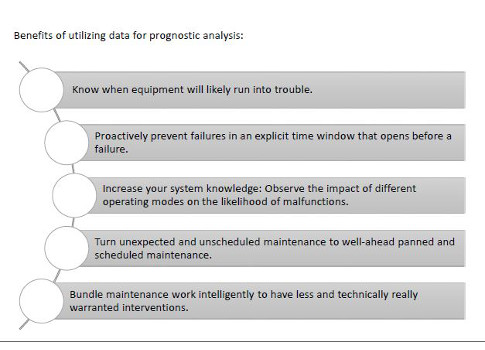
Predictive maintenance solutions offer an excellent starting point to use the data and move towards a data-driven maintenance strategy: based on data analysis it informs in advance that certain equipment will run into trouble soon. Prognostic solutions even go a step further by informing when the equipment will likely run into trouble. Prognostics — using data analytics to foster expert´s assessment of future availability and Remaining Useful Life (RUL) of assets — provides help to maintenance engineers in their daily working routine. Operations and asset managers also can make use of Prognostics for a proactive and efficient organization.
The following seven steps are necessary to turn your prognostic data analysis effort into a success:
1. Identification of assets to be monitored
Choose assets that are critical to continuous operation or those that would generate considerable costs or maintenance effort in the case of failure.
2. Identification of key malfunctions
List those malfunctions that reduce efficiency or reliability over time and shorten asset RUL. There is no need for a malfunction history – also malfunctions that have never been observed before for the equipment at hand can be listed.
3. Data review
Visualize the historical condition and process data from the equipment at hand in order to detect trends. Filter out downtime, startup, and shutdown and graph historical condition and process data for each component.
4. Formulation of parameters
Determine what data relates to which malfunctions and the type of the relationship (e.g. correlation or causation). Afterwards, create parameters involving arithmetic or logical functions and dependencies. Finally, check the data patterns for malfunction indicators or explanations.
5. RUL computation
Feed the condition and process data as well as malfunction and parameter specifications into a stochastic model. Project the asset´s condition over an explicit time horizon, apply diagnostic rules at various future time stages, and infer malfunction likelihoods. After obtaining malfunction-specific RUL distributions, total RUL distributions for each asset can be formed.
6. Result validation
Now that the bulk of the work is done, it is time to ask yourself: "Are these results plausible given what we assume or know now? How early can we make a reliable or useful prediction?" This is to check whether the results are plausible and the time frames used are appropriate for conclusive forecasting.
7. Benefit realization
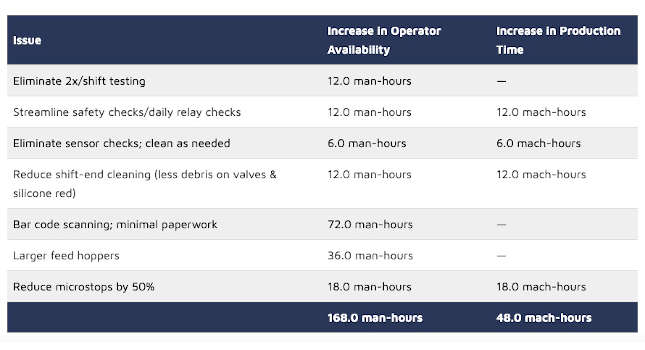
Now you are ready to reap the benefits that are outlined above. You know now how prognostic data analysis works and how you can use it intelligently to improve your maintenance strategy.
Moritz von Plate is the CEO of Cassantec, a company specialized in prognostic Maintenance. Prior to assuming this role, Moritz was CFO and managing director of an EPC contractor specializing in concentrated solar-thermal power plants. Julia Heggemann is the marketing manager of Cassantec. Her responsibilities include marketing, communication and sales. This article is contributed by SMRP, a CFE Media content partner.