Measurement, empowerment and control are the essential ingredients of effective enterprise optimization

FIRST OF TWO PARTS
Process optimization covers a lot of ground these days. There is a growing range of tools and techniques for optimizing labor, materials, production, the supply chain and perspectives, as well as many other things. Data collected and monitored within each function contributes to the overall tuning and optimization of the plant, and the accelerating speed of business makes it increasingly critical to view all optimization solutions as parts of an integrated whole rather than as standalone point solution.
But how can anyone bring it all together? Optimizing any single function is challenging enough, how can you possibly approach it at an enterprise level? The short answer is that you shouldn’t start any optimization initiative unless you can justify it within the context of your company’s business strategy at its highest level. But there is much more to it than that.
What is optimization?
In its broadest sense, optimization involves making an operation as perfect, effective or functional as possible. Since the 1970’s a much narrower definition has emerged, focusing on technologies or techniques for smaller parts of a business. In continuous processes, this might take the form of solutions that route information flow from a live process or simulation to one or more optimization “engines.”
These engines calculate the best approach to a set of conflicting business targets within a set of constraints, often to control process variability. In discrete processes, for example, Six Sigma, Lean manufacturing, finite capacity scheduling and numerous other techniques are used to structure methods that improve yield, quality and productivity or otherwise achieve short- and long-term business objectives. And some hybrid processes, like food production and packaging, also combine these elements.
Regardless of how broadly or narrowly one defines optimization, it always involves the management of tradeoffs. This traditionally includes tradeoffs at the unit level, such as throughput or yield versus energy and labor costs, or opting for long-term versus short-term gains.
Such optimization initiatives have had their share of success, certainly, but few companies ever realize its full potential, partly because of the growing complexity and speed at which business variables are changing today. For example, energy prices used to change weekly or daily. Now they can change hour by hour or even minute to minute. Another key problem is that the technical personnel who once supported the optimization have moved on, meaning that the company “solutions” have been abandoned.
Yet another challenge to successful optimization is the fact that the information required for sound decision making is often unreliable: It is late-arriving, inaccurate or incomplete. Sometimes instead of being simple numbers, the information is a statistical pattern that must be interpreted within margins of error.
And even when the information is reliable, matching sophisticated optimization solutions with how people make decisions is one of the greatest challenges to achieving optimal performance. Many such solutions assume that people will just follow and obey the instructions, but this isn’t always practical. Few optimization tools, for example, provide much guidance in helping people make tradeoffs between the short and long term, analogous to driving using only the rear-view mirror, instead of using the front and side windows as well.
Successful, real-time optimization requires a framework that works at the both point solution and enterprise level. Its three essential components are accurate, timely and sufficiently detailed measurement of business performance; empowering individual performance to understand and achieve those measures; and control of normal functions that maintain those measures. At that point, optimization becomes adjusting normal operations whenever necessary to achieve the established metrics. Figure 1 depicts these components.
Real-time operations measurement
The first component, operations measurement, is a prerequisite for any type of optimization. The measurement process asks how you know optimization success when you see it. Profitability, of course, is a key indicator, but how do you know for sure which parts of the business are contributing profit, and which are sapping it? What are the measures for smaller areas of the business? Until you know that, optimization efforts are stabs in the dark, at best.
The way to begin zeroing in on the right answer is to start with your business strategy. If your company is in the fortunate position of being able to sell every bit of product you can produce, your strategy is likely based on increasing output, and everything you do must align with that.
If, on the other hand, you are in a flatter market, your strategy might be to reduce costs. A key measure in that case would be real-time costs, built from the bottom up. This is different from key performance indicators (KPIs), which are built from the top down. Both are necessary, but neither by itself is sufficient.
Operations teams must understand how each operating area is currently working, and at times require a performance forecast, so they will have enough time to respond effectively. This includes measuring such things as throughput, efficiency, cost, quality, availability and utilization as dictated by the business strategy.
A hierarchical planning model can be used to map the business strategy to the plant floor, using multiple layers of activity and identifying what needs to be measured to execute the strategy. (Figure 2)
Although the process of identifying the measures provides a sense of clarity and can itself move you toward optimization, it does not contribute to real-time enterprise optimization until executives, managers and operators are empowered to apply these measures.
Real-time operations empowerment
Empowering people to implement necessary actions is the second most essential ingredient for real-time enterprise optimization. It effectively connects information with users and their decision-making methods. Because data often changes too quickly, too slowly or in complex patterns, most support personnel do not have time to browse the information, especially in the midst of solving a problem.
Sometimes a problem does not show up until the next monthly ERP report, which is often far too late. A work center assembling custom computers, for example, might switch components in a matter of minutes and start new orders dozens of times during a day. A refinery distillation unit might change cuts two or three times a day, directing product streams to different post-processing units or storage tanks. Viewing such information after the fact not only jeopardizes the reliability of the data, it also comes in too late for anyone to take corrective action.
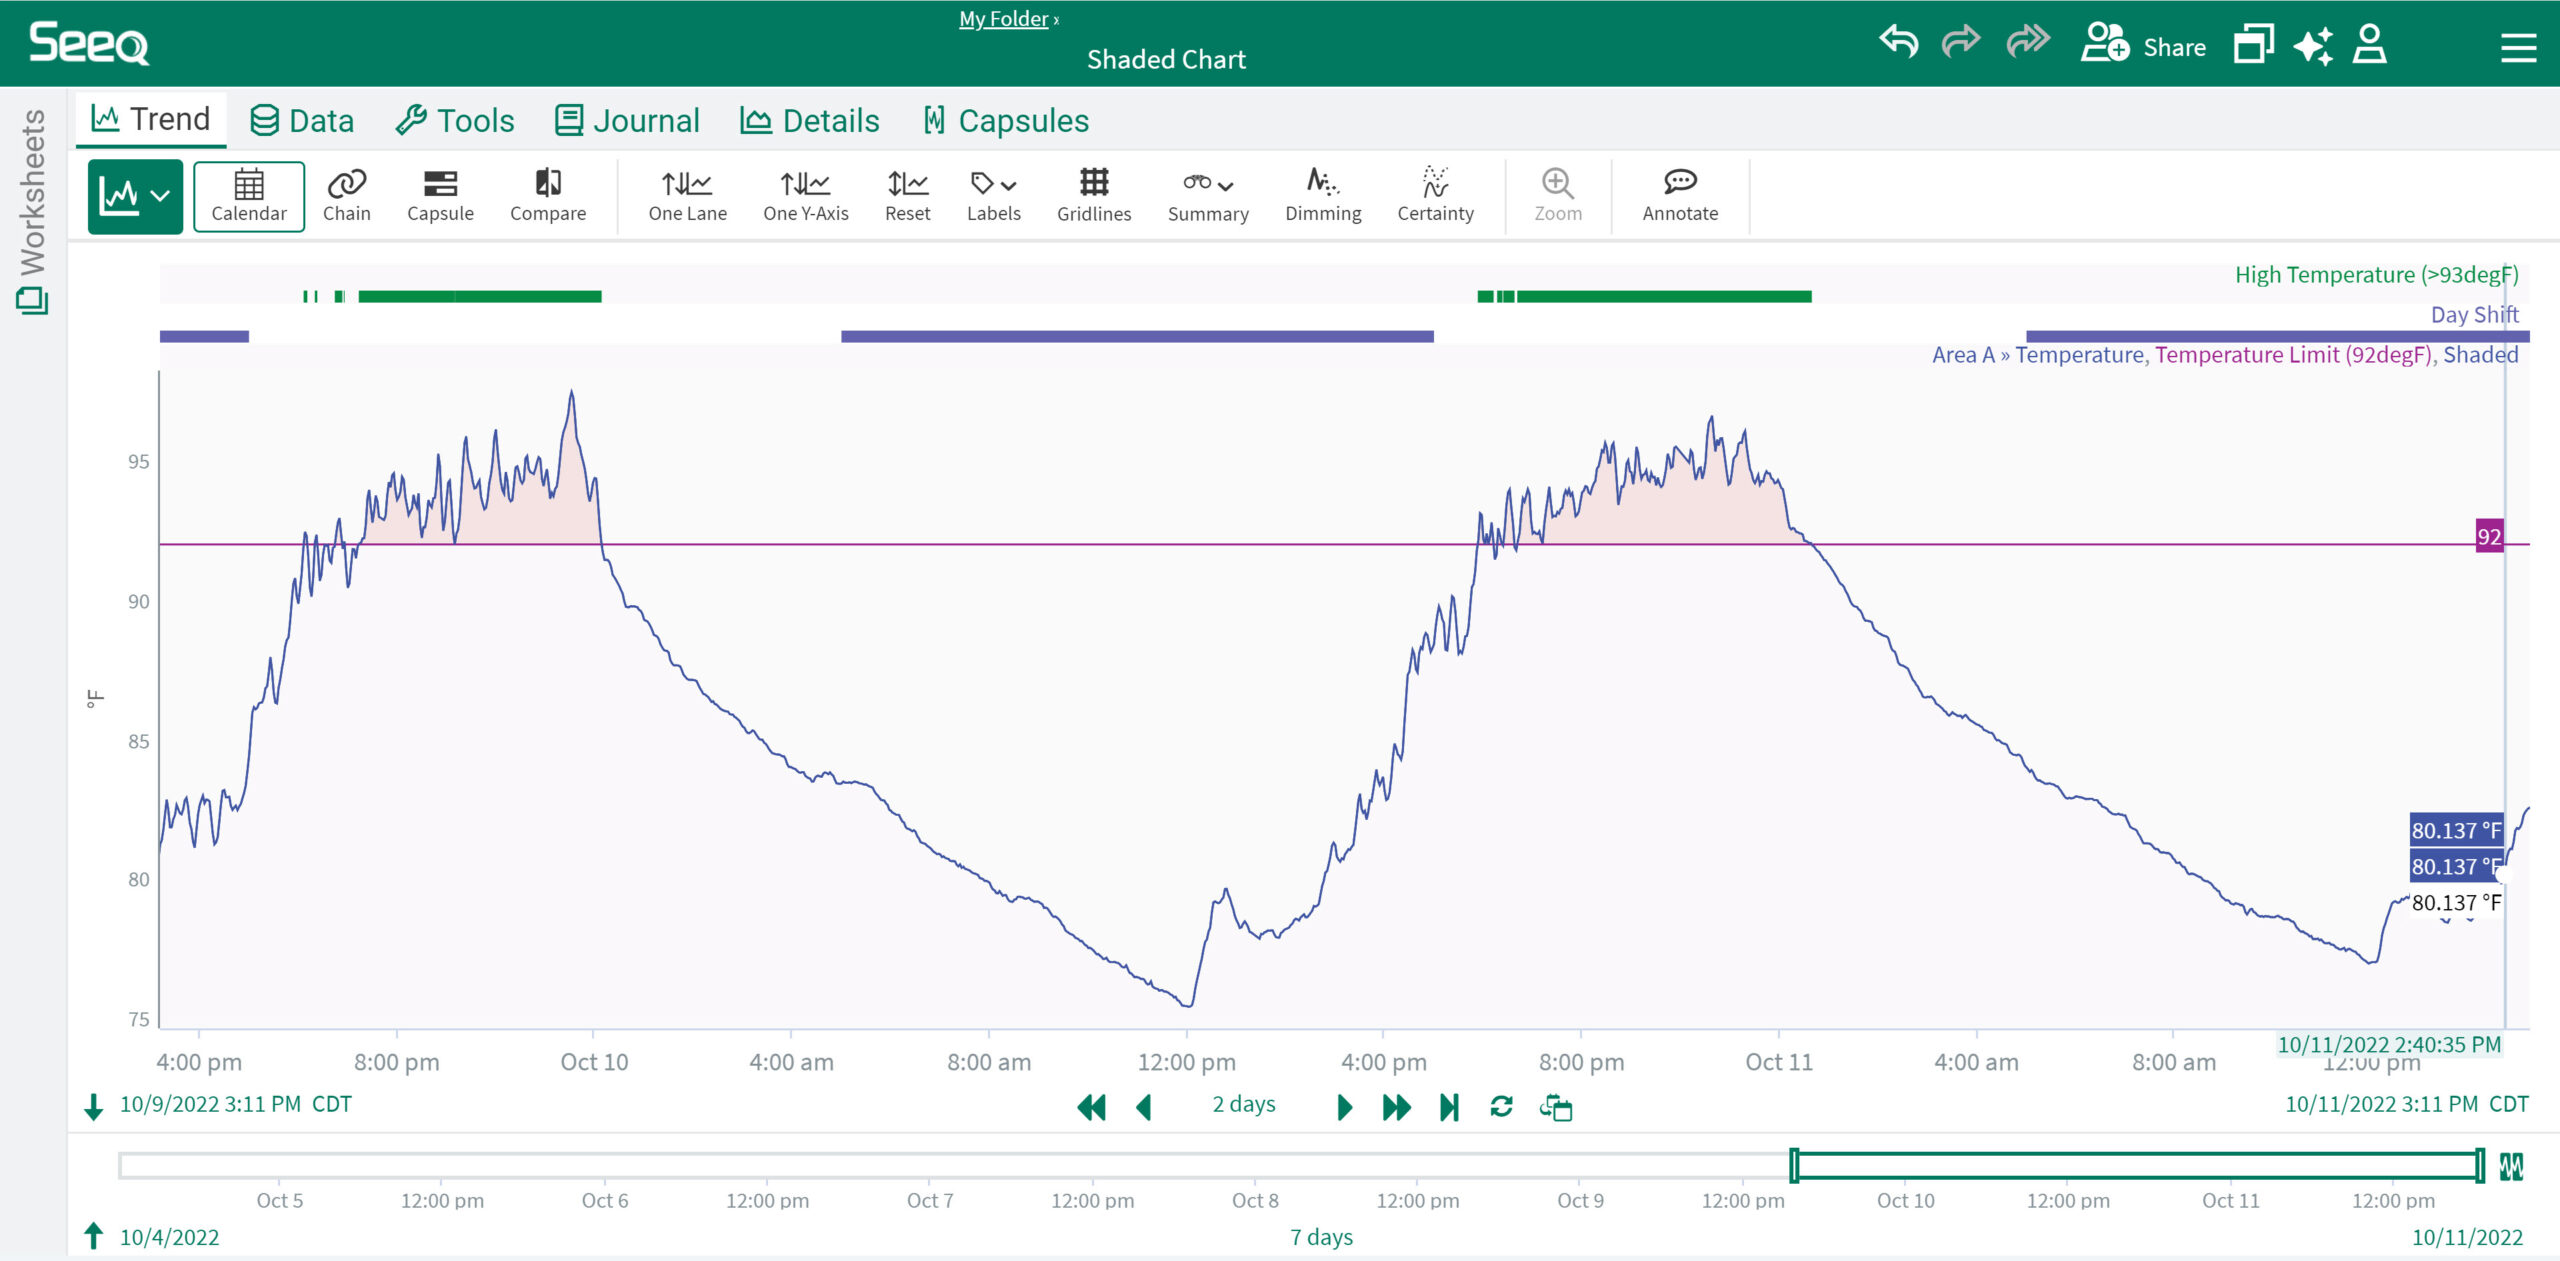
Better information can be presented to operators as it is required, for example through combinations of manufacturing execution systems (MES), enterprise manufacturing intelligence, (EMI) or human machine interfaces (HMI). These systems might present contextualized, visibly rich information, enabling data that relates to the manufacturing process and presents operators with alarms when pre-established thresholds are met. This can be in the form of the dashboards shown in Figure 2 or a combination of real-time, online statistics and rules, and is a comparison of operations behavior to constraints and targets.
Empowerment strategies might be based on helping plant personnel visualize operating parameters such as energy cost, raw material utilization or yield rate, but they could just as easily relate to safety or environmental regulatory compliance or even profitability. Operators can then consistently and predictably react, resulting in stabilized and standardized operations and output.
Senior operators and dispatchers within a fleet of power generation units, for example, might share a common visual management screen, where performance is displayed in forecast trends compared to limits, and all transgressions (over/under generating), penalties or lost business opportunities are displayed.
A manufacturing complex might share a common visual management screen showing energy costs, emissions, throughput and product costs, enabling supervisors to adjust performance targets in real time. Specialists could be alerted that a set of equipment is changing performance faster than planned, enabling them or the team to change schedules or plan for intervention. Remote and mobile specialists who share responsibilities can be more effective using these techniques.
Or energy usage and utilities optimization software can allow operators to view a company energy profile and optimize around supply and costs. The profile might show that it is less expensive to manufacture in the morning so that energy-intensive operations can be rescheduled accordingly.
Such context helps control room operators, maintenance technicians, engineers and their supervisors make timely and more-effective decisions to control operations in support of strategic metrics.
Using better process analysis
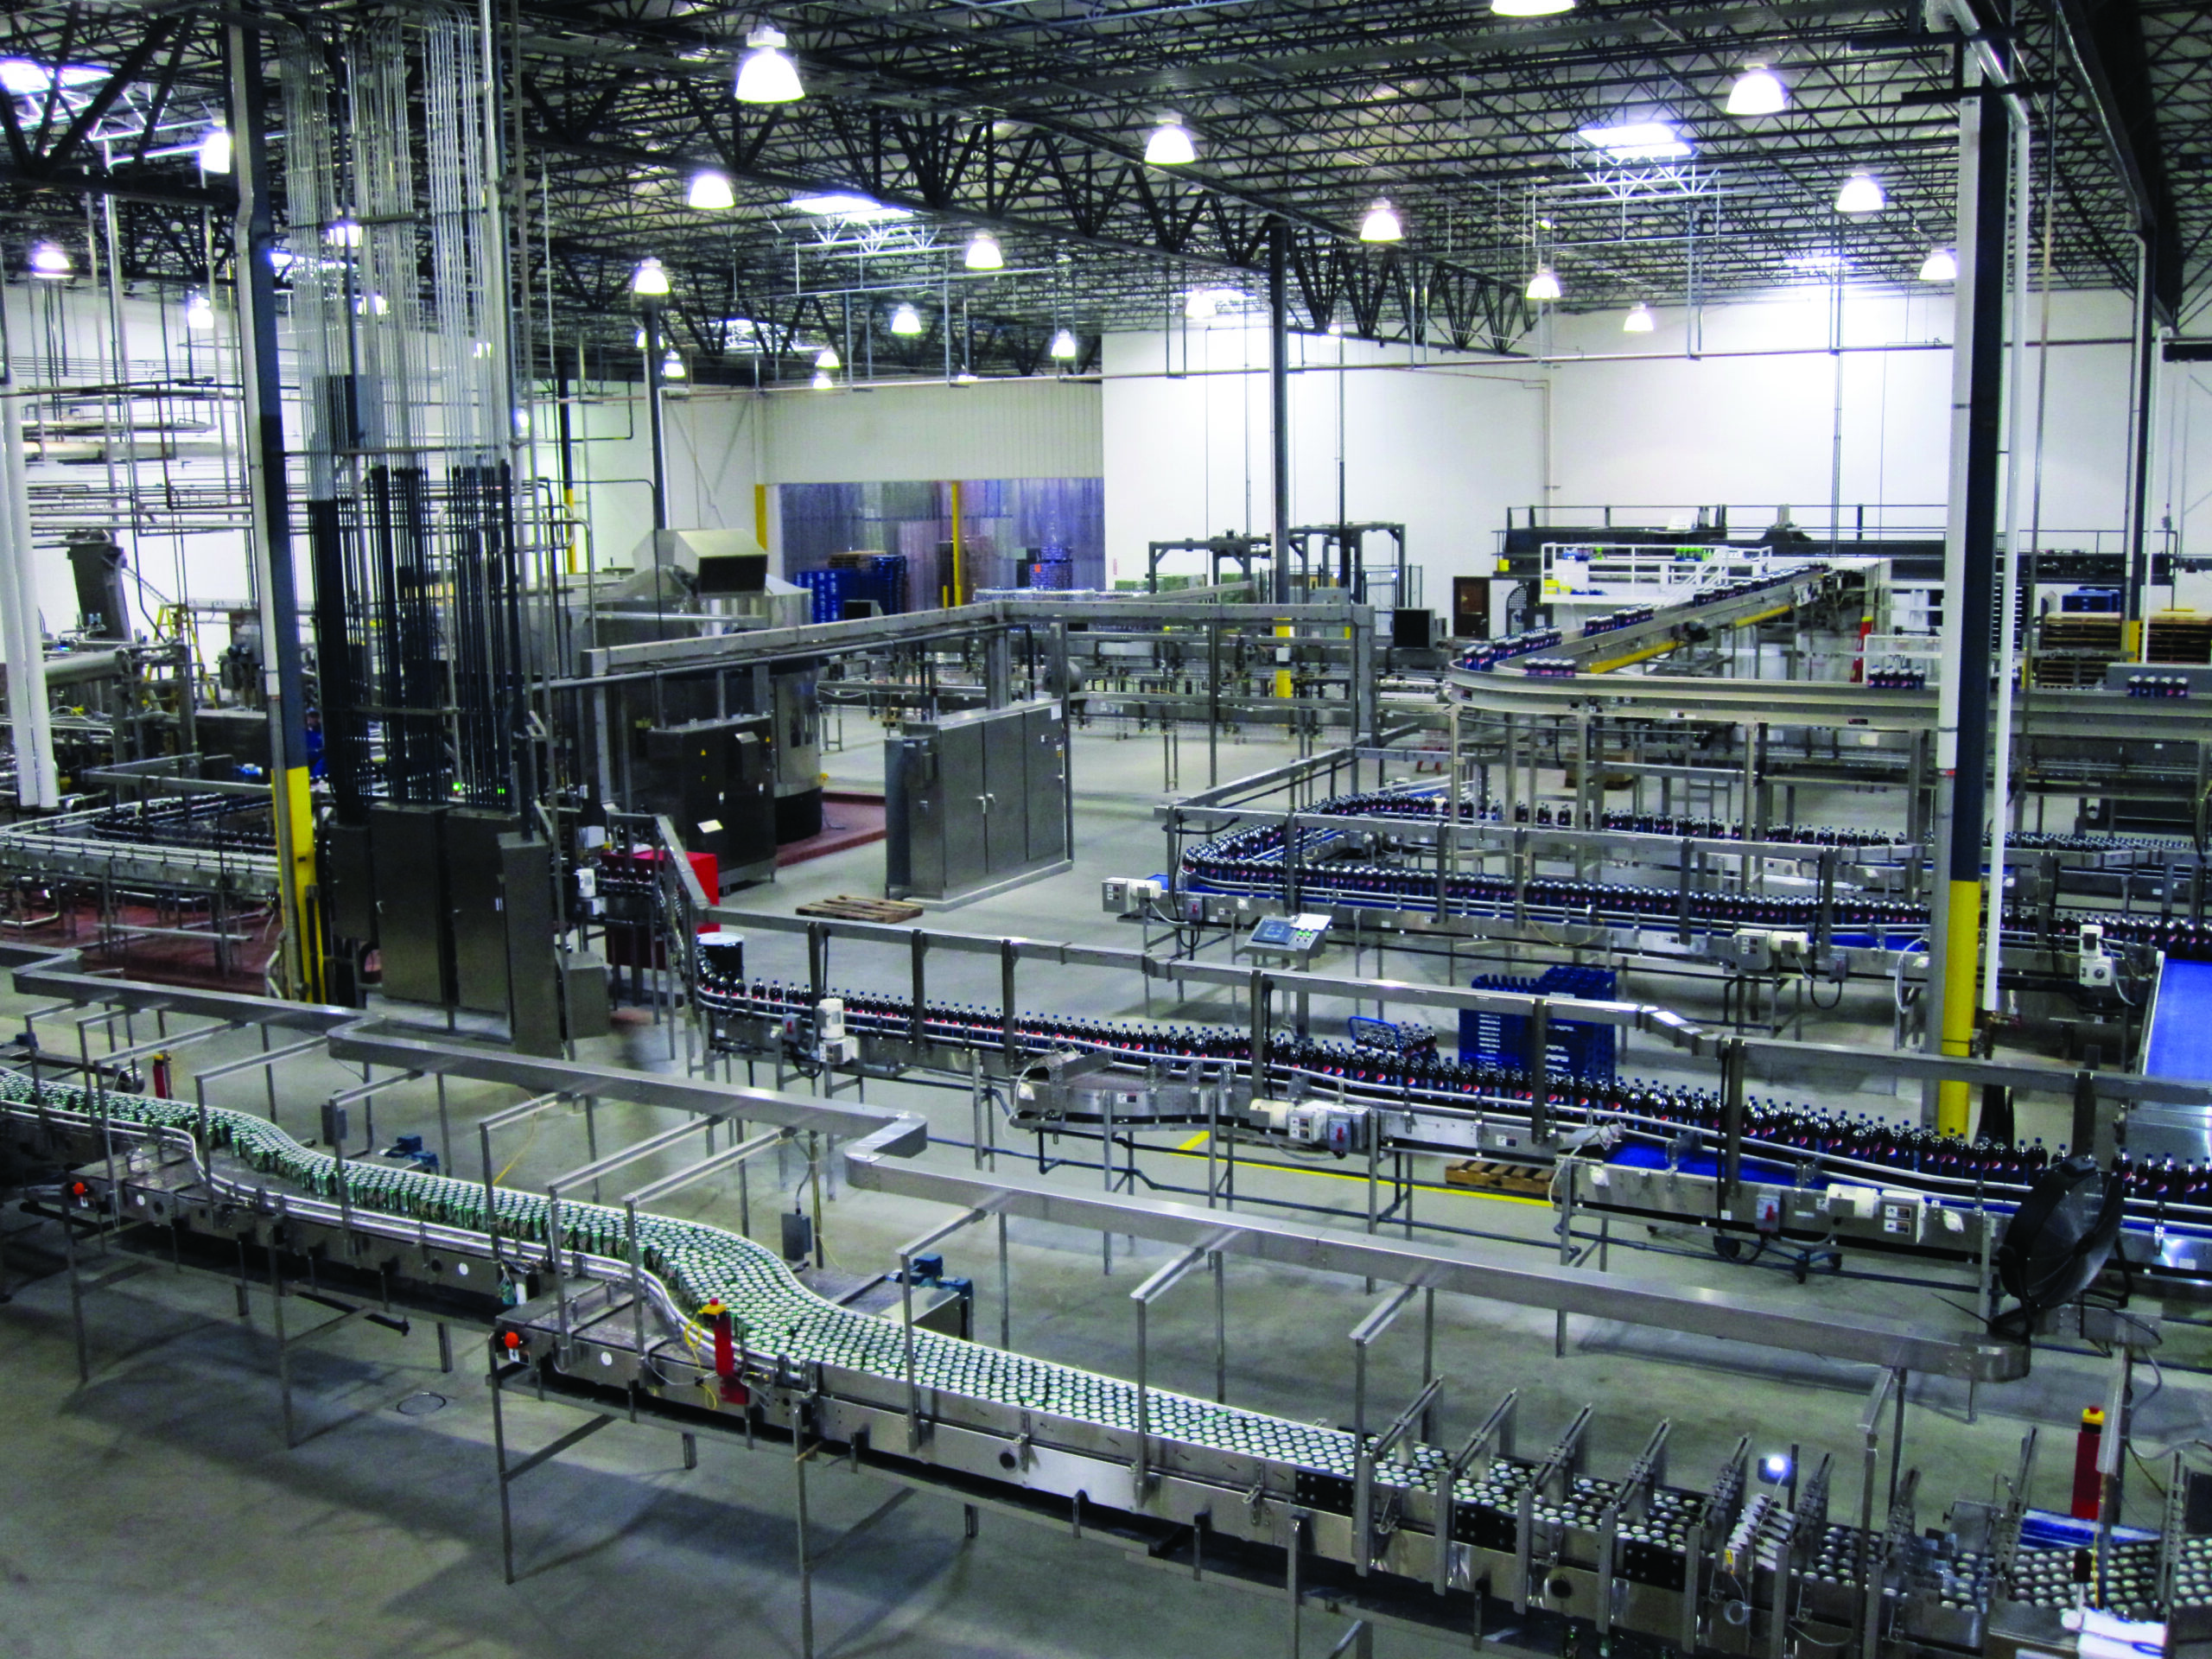
Pepsi Bottling Ventures (PBV), of Nampa, Id., was looking to optimize the process by which it manufactures and distributes more than 100 different flavors and brands. With such a wide variety of products, making smooth switches between formulations was central to the plant’s productivity, making changeover a key strategic metric. Prior to the optimization, engineers estimated that changeovers took 60 minutes.
Using analysis and visualization software, in this case Wonderware from Invensys, PBV was able to identify the chief constraints and their root causes. Armed with this data, they determined that the most critical bottleneck was in the filler process. Addressing this issue improved changeovers by up to 45 minutes and resulted in additional savings in raw materials and packaging. Efficiency on the filler line increased 10%.
Using better maintenance management
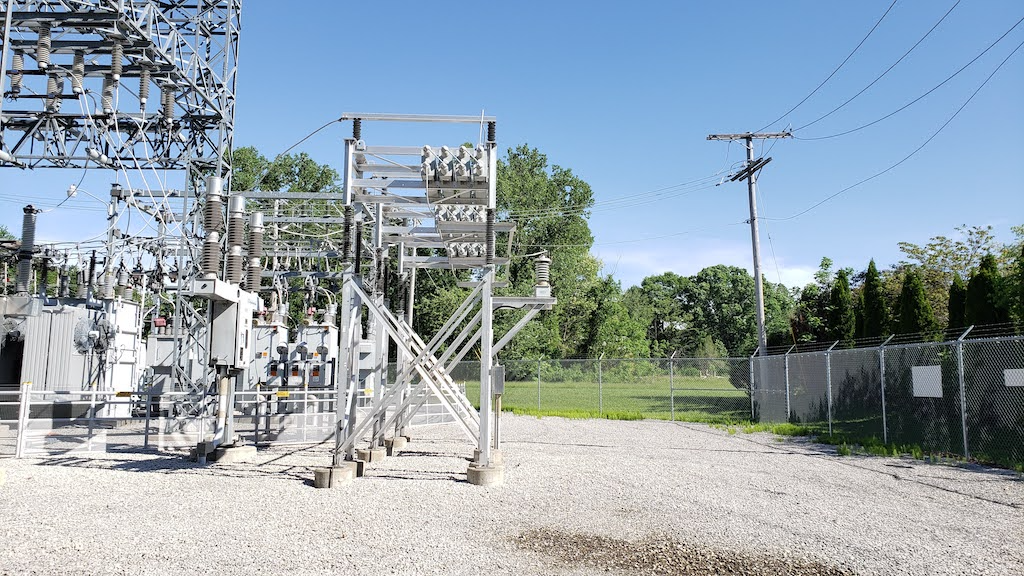
Sometimes the metrics are the end result of an optimization process. Vectren Corporation, an Evansville, Ind., power company, set out to develop a maintenance model that would help drive down the cost of doing unplanned work and improve the ratio of planned to unplanned work. Using Avantis enterprise asset management software from Invensys, Vectren implemented a work-order tracking system that integrated data on planned and unplanned work with expenditure data.
The software allowed Vectren to set better performance metrics on backlog trends, preventive versus corrective activity, system costs and top ten entity costs, all of which helped the company improve the allocation of its operations and maintenance budgets.
Some 250 Vectren employees now use this system to streamline and continuously improve maintenance of more than 6,000 unique assets, involving more than 33,000 spare parts.


