The growing adoption of advanced analytics is improving data availability, process insights and operational decision-making, driving energy efficiency and more sustainable production.
Self-service analytics insights
- Advanced analytics platforms ease essential data preparation tasks, such as data cleansing and alignment across sources.
- Self-service analytics help organizations unlock hidden inefficiencies, reduce technical dependency and accelerate digital transformation.
- Unified platforms enable subject matter experts to build asset trees, standardize key performance indicators and perform data cleansing in a single environment.
Energy efficiency is a critical driver of operational excellence, sustainability and regulatory compliance across industrial sectors. According to the International Energy Agency, energy improvements in the industrial space could deliver over 40% of the emissions reductions required to meet global climate goals by 2040.
However, despite widespread deployment of sensors and monitoring systems, many plants still struggle to translate data into actionable insights due to siloed databases, delayed reporting and other challenges caused by legacy software and monitoring systems.
Fortunately, modern self-service advanced analytics platforms address these and other challenges by enabling engineers and operators to directly access, analyze and visualize operational energy data without specialized programming expertise. For example, monitoring key performance indicators (KPIs) — such as specific energy consumption and energy intensity index (EII) — empowers plant personnel to detect inefficiencies in real time, promoting continuous improvement.
Traditional challenges in energy efficiency monitoring
Before the rise of self-service analytics, energy efficiency monitoring was largely manual and centralized, constrained by limited technology and access.
At one manufacturing company, a process engineer responsible for generating a monthly energy consumption report spanning 20 global sites spent most of their time:
- Manually extracting process data from the historian
- Importing that process data into an Excel spreadsheet
- Requesting manual meter readings from each site
- Cleansing poor-quality data
- Validating anomalies with site personnel
This required determining whether issues stemmed from instrument failures, planned shutdowns or unexpected trips.
After adjusting the data based on site feedback, the engineer would apply KPI calculations and create visualizations, such as bar charts and tables, in Excel. These reports were finally shared with stakeholders, including plant managers and chief financial officers. Ad hoc requests, such as power consumption for a specific site, took several days to fulfill due to the manual and time-consuming workflow.
Pain points of manual energy consumption reporting
The engineering team at this company identified three primary pain points in this workflow:
- Manual data collection and utility billing: Energy usage was historically tracked via manual meter readings and monthly utility bills, providing delayed and low-resolution insights. Facilities sometimes employed interval data recorders — e.g., 15-minutes or hourly — but these still required manual download, analysis and meter and log updates. Monthly utility bills served as the primary data source.
- Spreadsheet-based analysis: Data collected was typically entered into spreadsheets, like Excel. This procedure was time-intensive, error-prone and lacked real-time insight capabilities. Following data entry, users needed to manually calculate KPIs, such as EII and cost per output unit.
- Delayed insights and reactive decisions: Most decision-making was reactive, with little real-time feedback or forward-focused projections to reference, due to limited report frequency, such as just once per month. Ad-hoc reports were typically unavailable and even when they were, they lacked self-service features, forcing users to rely on analysts or information technology (IT) teams for detailed information.
Before self-service advanced analytics, plant personnel were limited by:
- Slow insights
- High technical dependency
- Limited anomaly detection
- Low accessibility for nonexperts
- Missed energy-saving opportunities
Bolstering energy analytics with integrated data systems
Modern day self-service advanced analytics platforms integrate all data sources into a single, centralized software environment, empowering users to analyze plant- and enterprisewide data. This is particularly useful in industrial settings where information is often scattered across various systems and tools.
When data from multiple sources — such as historians, energy meters, supervisory control and data acquisition systems and maintenance databases — is consolidated into a unified platform, subject matter experts (SMEs) gain instant access to the indispensable information needed to perform advanced analytics and generate meaningful insights. This places the data required to create energy monitoring and other reports readily at their fingertips, eliminating delays caused by navigating disparate systems or relying on IT teams to extract and share information.
Within this unified environment, SMEs can build structured asset trees and organize equipment and systems into logical hierarchies. This framework empowers teams to efficiently identify and isolate specific information among thousands of signals, streamlining navigation and improving productivity.
More importantly, standardized KPIs such as energy intensity, efficiency ratios and baseline comparisons can be embedded directly into the asset trees. These KPIs can then be replicated and scaled effortlessly across all sites within an enterprise, ensuring consistency in performance monitoring and benchmarking.
Advanced analytics for data preparation
In addition to analysis and reporting, advanced analytics platforms ease essential data preparation tasks, such as data cleansing and alignment across sources. Whether values are missing, outliers are present or timestamps are unsynchronized, these software systems automate data conditioning, eliminating the need to move information among external tools, like spreadsheets. This end-to-end capability within the single platform provides SMEs with full visibility and control over data workflows.
Ultimately, this integrated approach optimizes the entire analytics workflow, empowering SMEs to take ownership of their insights, respond to issues in real time and continuously drive energy usage and operational performance improvements throughout the organization.
Asset tree design, KPI calculation and dashboard validation
In a recent project by the previously referenced company, a plant SME with no coding knowledge used a point-and-click self-service advanced analytics platform to align signals across all 20 global sites, create KPI calculations and share insights with stakeholders, all within a month. The resulting real-time energy dashboard replaced static Excel reports, empowering faster and data-driven operational decisions.
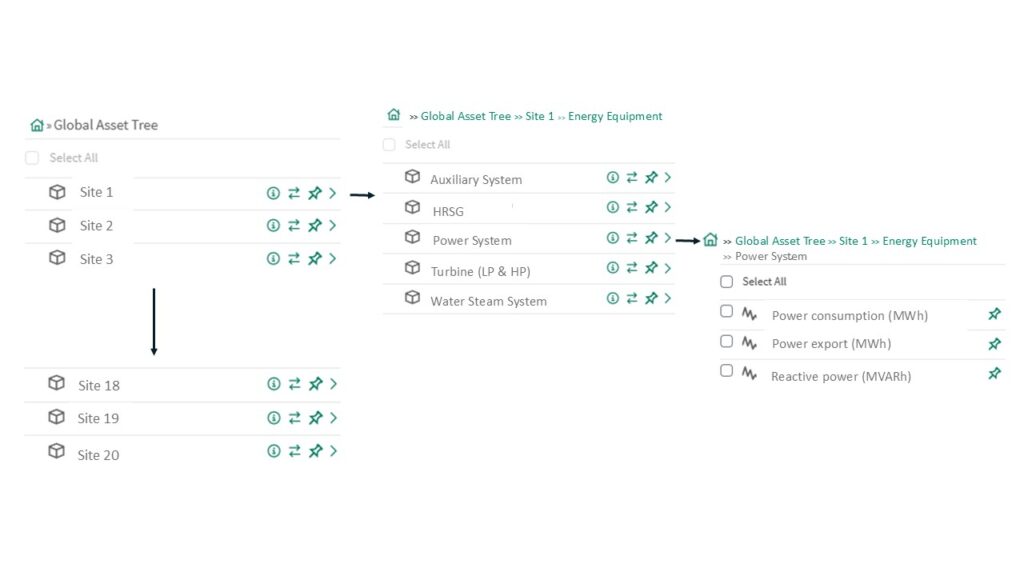
The site SME collaborated with the central data team to develop a global asset tree using a self-service, point-and-click tool designed for nonprogrammers, intuitively empowering the SME — despite having no Python or coding background — to contribute effectively to the setup process. They started by engaging site teams to ensure accurate selection of historian signals, requiring around 10 working days of extensive back-and-forth communication across the 20 plants to validate the correct data sources to use for each energy system.
The asset tree was structured in three tiers (see Figure 1). The first level consisted of all the sites, while the second level categorized core energy equipment at each site, including boilers, electrical systems, steam systems and turbines. The third level housed the specific KPI signals and their calculation logic, mapped directly to each asset.
How built-in analytics address data quality
Data quality issues — such as invalid points, noise and inconsistent units — were addressed using built-in analytics functions, ensuring clean and standardized data for analysis. The KPI calculation setup took approximately three working days.
Once the calculations were configured, the SME compiled them into a centralized workbook and shared the URL with plant managers using access control features to provide read-only access. This facilitated easy collaboration and validation.
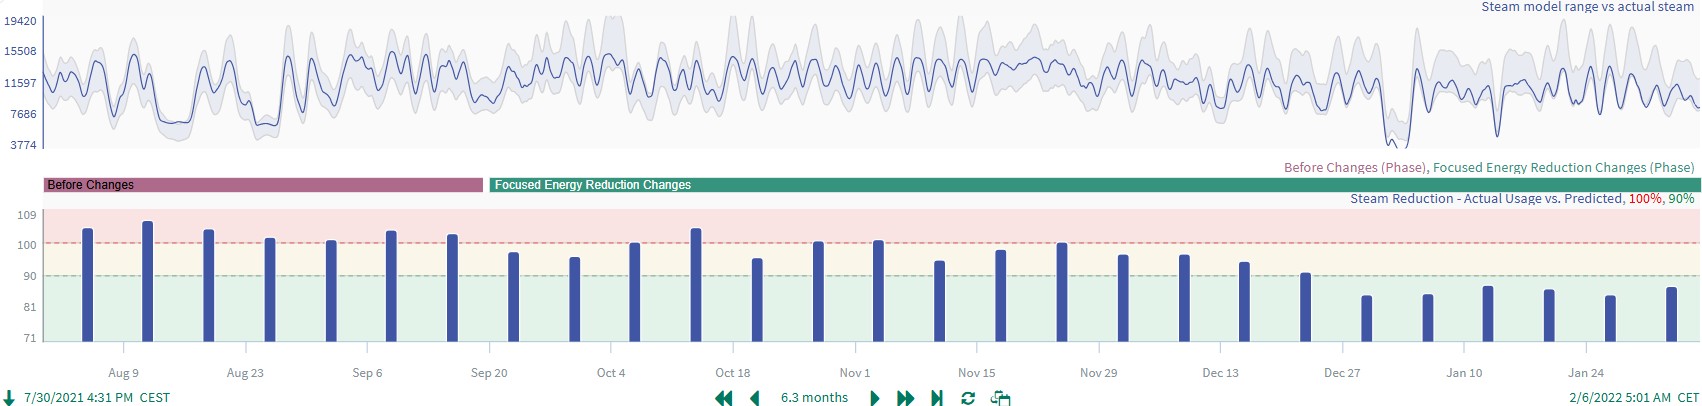
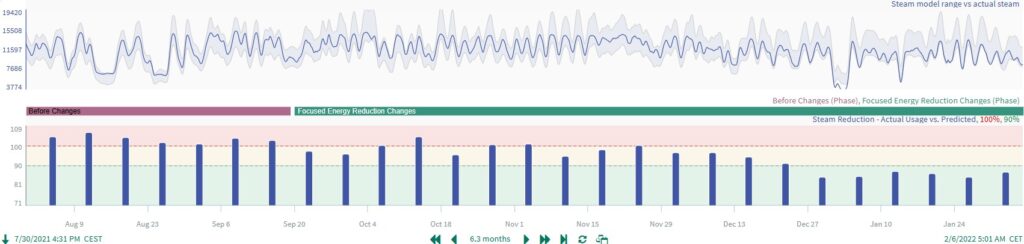
Feedback and corrective actions were documented within the workbook’s journal feature, streamlining communication and supporting online review meetings. This enabled SMEs to perform comparative analysis before and after implementing energy optimization initiatives (see Figure 2).
The central data team then integrated the verified KPI signals from the asset tree into a business intelligence tool to develop near-real-time dashboards (see Figure 3).
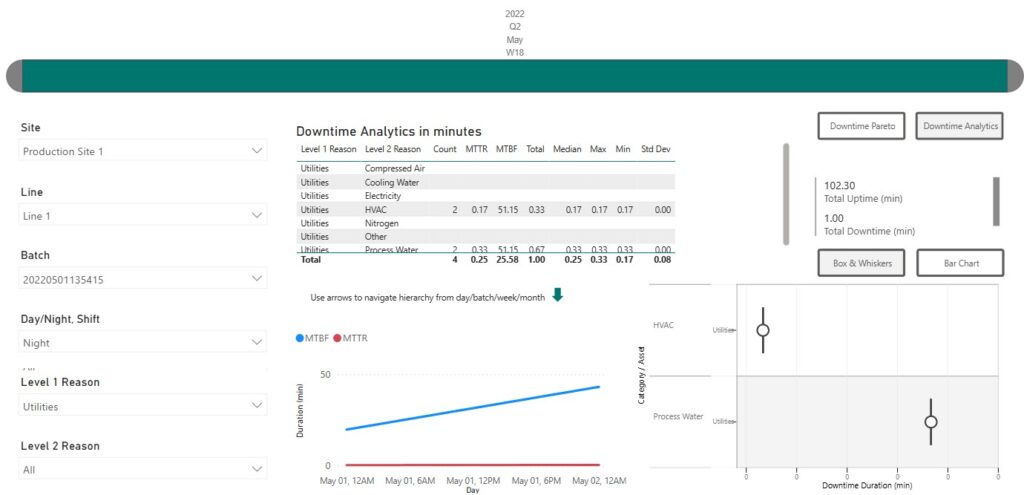
These dashboards provided visibility into power consumption and energy efficiency across all sites. However, the validation process took a while, approximately two weeks, due to the need to build stakeholder confidence in the shift from traditional Excel-based reporting to real-time digital dashboards.
Although the full project took roughly a month from initial setup to stakeholder validation, the SME successfully accomplished most of the work via independent initiative leveraging the self-service analytics platform. This one-time setup proved invaluable, providing key stakeholders with near-real-time access to critical energy data, enabling faster data-driven decisions to improve energy use across the organization.
Self-service analytics pave the way for artificial intelligence (AI)-driven insights
Organizations must prioritize self-service analytics adoption to unlock hidden efficiencies, reduce technical dependency and accelerate digital transformation. Widespread adoption of self-service analytics is paving the way for AI-driven insights, continuous optimization and a more agile and energy-efficient future.
For example, Pfizer’s Puurs, Belgium, facility reduced energy consumption by 20% through enhanced heating, ventilation and air conditioning monitoring. Meanwhile, BASF’s Ludwigshafen site improved utility efficiency by over 12% by optimizing steam and compressed air systems. And Nestlé achieved a 15% reduction in energy use per ton of product by embracing predictive analytics.
Traditionally, energy monitoring relied heavily on centralized teams, manual data handling and delayed reporting, which resulted in many missed opportunities for savings and operational improvements.
However, self-service platforms are empowering SMEs to access, analyze and act on energy data directly, without relying on — but creating collaboration opportunities with — IT and data science teams.
By consolidating data sources like historians and individual meters into a unified platform, SMEs can build asset trees, standardize KPI calculations and perform data cleansing in a single environment. This streamlines workflows, eliminates spreadsheet inefficiencies and ensures real-time visibility into energy performance across sites throughout the enterprise.