Here’s how advanced analytics software finds the root cause of, and the solution for, operational delays in batch processes.
Delays in batch processing operations result in reduced throughput and decreased profitability. The combination of concurrent and independent steps can lead to bottlenecks, causing the process to pause and wait for a downstream operation to finish before the preceding steps can move forward. This introduces latent time to the cycle and lengthens the time required to complete each batch, leading to reduced overall equipment effectiveness (OEE) and higher costs.
Understanding and measuring this latency can be an impactful project justification metric, as well as a critical key performance indicator (KPI) when measuring operating performance. When viewed individually, each of these waiting periods may seem brief or unimportant but totalizing all of them into a single number often tells a more meaningful story.
Lost time analysis for batch processes can be easily completed with advanced analytics software, such as Seeq, using just a few point-and-click tools. Once these periods are identified, advanced analytics can be used to find the root cause and solution for each delay, resulting in reduced batch cycle times and increased throughput.
Identify batch cycles
The first step for identifying batch cycles is defining capsules, a Seeq feature used to identify time periods of interest to represent each batch. If a process historian is present, it may have an available signal to track the batch number or ID. If so, the “.toCondition” function in Seeq Formula can be used to create a definition of the batches, and each new batch will get its own capsule when the batch ID changes.
If there is a “Batch_ID” type tag in the historian, chances are there are also tags for individual batch processes/operations/phases. Taking the analysis a step further for specific portions of a batch can help zero in on unit constraints within each batch, providing added precision when quantifying and addressing bottlenecks.
If the historian doesn’t have a clear signal for each batch, more creativity is needed to identify batch cycles. Any batch process has repeatable parameters—such as tank levels, temperature signals, agitator amp readings, valve open/close status, etc. — indicating the end of one step in a batch and the start of another. Using advanced analytics software, it is easy to create capsules representing each batch. This can be done using tools such as Seeq Value Search, which can be used to create capsules based on a signal’s relationship (above, below, equal, or not equal) to a prescribed value.
Another alternative is creating a simple timer created within the Seeq Formula tool using the “.TimeSince” function. If the batch phases are more complicated to define, Formula has options for calculating derivatives, timers, and other values.
Taken as a whole, using process parameters to define the batch isolates the steps such as cooling down, heating up, or charging a reactant. If there is a period of the batch that doesn’t fall into one of these operations, it may indicate latency. These gaps, once identified using these same steps, could be the basis for a separate process investigation or an OEE project. With spreadsheets or other general-purpose tools, it is extremely tedious to scale batch definitions across time, but this is as simple as expanding the “Date Range” in Seeq.
Once each batch is identified as a unique capsule, the duration of each capsule may be viewed in the Seeq Capsules Pane, shown in the lower right corner of the display. Batches can be sorted by duration to identify the one with the shortest cycle time (see Figure 1).
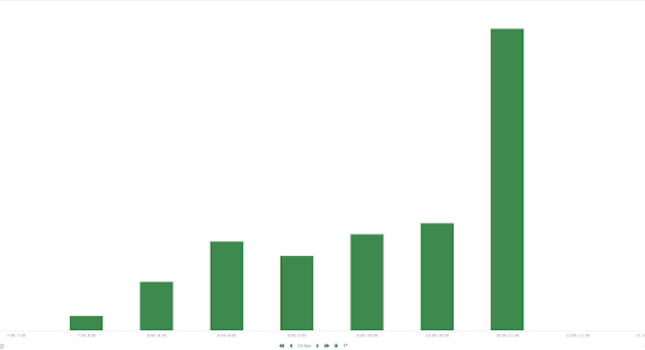
Once batches are sorted by duration, nuances among batches can be explored to find the causes for the differences in batch times. Some batches will inevitably be shorter or longer than others, but why is one batch faster than the rest? For this batch, what factors set it apart as the fastest? This requires further investigation, but for the time being, the analysis can be simplified by only considering the duration. Advanced analytics software makes visualizing the distribution of batch times easy using a histogram tool (see Figure 2).
The histogram provides context to subject matter experts (SMEs), process engineers, and others with experience and expertise in the system, showing them where a particular batch stands with respect to the others. It helps to answer the question: “How fast or how slow was this particular batch?”
Benchmark the batches
Once each batch has been identified, the next step is to select a benchmark. One way to do this is by selecting the fastest batch, but some OEE and operational performance guidelines suggest benchmarking using the 85th percentile because this may be a more realistic target than an outlying batch with a short cycle time. In this case, the target batch time will be just longer than the slowest of the 15% fastest batches.
Again, the Seeq Formula tool may be used to execute this step, with the fastest batch selected or the benchmark batch duration in mind, then the “afterStart()” function can be used to create a best batch condition that starts when the batch capsules start. The desired batch duration is determined using the fastest batch time or the selected benchmark. Results can be monitored with visualizations in near real time.
To this point, the analysis should show conditions presented as two layers of capsules that start at the same time. Most, if not all, of the batch capsules should be longer than the target batch time capsule, since the target batch was set at the 85th percentile. Identifying, isolating, and aggregating these differences in batch duration will constitute the remainder of the analysis.
Isolate batch processes
Using the “Composite Condition” tool in Seeq, an SME can isolate this difference and create another condition for it. There is built in logic in Seeq for creating a new condition based on the two conditions already created. For this case, one would select the outside logic (i.e., a time period of interest outside a defined time period of interest). Once identified as a condition, this new measurement of duration versus the 85th percentile duration will be generated if the batch is over the target time, as shown below in the Lost Time condition, with red capsules representing each ‘outside’ event (see Figure 3).
Aggregate batches
Aggregating the newly minted condition for lost time provides visualization of the total latent time in the batches over the course of the display range (see Figure 4).
Creating this metric is accomplished using the Seeq “Signal from Condition” tool. This will take the lost time condition and create a single number showing the total lost time over the given time range. By changing the time range or period of interest, one can visualize the amount of process latency.
For example, setting the time range to a year will immediately totalize the lost time for the year. Then using process knowledge and subject matter expertise, the lost time can be translated into a dollar amount using the “Formula” function.
Turn batch process insight into action
Latent time for a single batch may seem inconsequential, but aggregation will create a concise metric showing the total latency over the entire time range. This value can be used to calculate the total opportunity in terms of potential increased production and OEE.
Often, SMEs are aware of the issues holding back production because they know the bottlenecks. However, the exact nature of these issues has previously been difficult to quantify using a general-purpose tool, such as Excel. The data has always been there but accessing it in a meaningful way was challenging.
Advanced analytics software addresses this issue because building any type of analysis is quick and simple. The resulting findings may be used to create project justifications, return on investment calculations, or other metrics that plant leadership needs to see before greenlighting the capital spend required to address the bottleneck. In the best case, improvements might only require changing code in a controller, correcting an instrument’s calibration, or performing maintenance on a control valve. In other cases, new equipment might be required such as an improved heat exchanger.
In addition, Seeq Chain and Capsule views may be used to compare and contrast signal profiles across batches, highlighting anomalies negatively affecting batch durations, and helping determine what sets best batches apart from the rest. SMEs often have an idea of what the constraint is, but advanced analytics software empowers experts to make data-driven decisions.
Once the lost time has been identified in a batch process, identifying the cause of the bottleneck requires a deep dive. What is the distribution of times for each of the individual constituent parts the batch? Is the process heating or cooling limited? Is the feed rate or filtration time delaying the batch? SMEs are best positioned to ask and answer these types of questions, preferably using advanced analytics software to speed and simplify analysis.
Doug Beach is a data strategy consultant for Seeq Corp., with a background in specialty chemical process engineering and capital projects. He was previously employed by Syngenta Crop Protection in the agricultural chemicals space, working in both batch and continuous environments to create process improvements. Beach will continue to create value across industry verticals through digital transformation and use case development. He has a BS degree in chemical engineering from the University of Virginia and is currently pursuing his MBA from the Foster School of Business at the University of Washington in Seattle.