The devil is in the details
There is a well-reported and widely recognized explosion of time-series data creation and storage systems, including historians, open source and data-lake options, and cloud-based services. Due to these attractive storage options — along with lower prices for sensors and data collection — industrial organizations are awash in Industrial Internet of Things (IIoT) implementations and big data. But what’s the most common complaint among these companies? They are data rich and information poor, with so much data and so few insights.
One of the main challenges is the collected data isn’t ready for analysis and realization of benefits, its main purpose. Some estimates have more than 70% of the effort expended on analytics being used in simply moving data from a “raw to ready” state using data cleansing, or as the New York Times calls it “data janitor” work. This grinding monotony of collecting, organizing, cleansing and contextualizing data in the analytics process is thus a huge hurdle to creating value from raw data.
Two prerequisites must be satisfied to get data from “raw to ready” and fit for analysis: data access and employee expertise.
Data access
It’s wrong to assume that most employees have ready access to data. In many organizations users are blocked from the data they require for analytics. This is because “data governance” — the rules and processes employees must follow to access data — is a focus of many IT departments as they attempt to address security, privacy and confidentiality issues.
At the same time, data access is a prerequisite for what comes next, which is the process of creating analytics-ready data for insights. In addition, a clear best practice for manufacturing organizations is to store process data in its native form without summarization or cleansing. This is because any assumption about how to manipulate the data prior to the time of analytics may be detrimental to the investigation.
Data should only be manipulated at “analytics time,” and then only by the subject matter expert (SME) leading the analytics effort. Pursing a path of data cleansing, summarizing or other changes to the source thus risks removing exactly the data and details that could prove important to the investigation. Access to data in its source form is therefore the first prerequisite.
Employee expertise
The second prerequisite is the expertise of SMEs, the process engineers and other employees with expertise in the data, assets and processes of the industrial plant or facility. These SMEs have been analyzing data for 30 years with spreadsheets, which was preceded by the use of slide rules, pen and paper.
Putting these employees and their expertise together with access to data is a critical step because only at analytics time can the right decisions be made with respect to the subsequent data cleansing and contextualization steps. Without this expertise, the result of analytics is frequently a misadventure in spurious correlations or known relationships that are understood within the plant context, if not by those solely focused on the data science. In other words, an algorithm turned loose on big data will typically reveal thousands of potential problems, few of which are really challenges. For example, who really needs to know that no product is being produced when the main power supply to plant is off.
By enabling the front line of expertise in their organizations, manufacturers can realize a host of yield, availability, productivity and margin improvements from data analytics.
With access to the data, SMEs can ready data for analytics through integration and alignment of data from various sources, also called contextualization. Contextualization goes by many terms depending on the vendor and industry — including data harmonization, blending, fusion, blending and augmentation — which all mean the same thing: the integration of data with intent to inform or integrate across unlike data types. The reason for this is there are no “handles” in a time-series signal, so SMEs have to (at analytics time) find a way to integrate “What am I measuring” (the sensor data) with “What am I doing” (what an asset or process is doing at the time) and even “What part of the data is important to me?”
Creating context
As an example of the challenges found when working with time-series data, consider a simple time-series data set with sensor data recorded every second for a year to create 3.1 million data points, each in the form timestamp:value.
Most likely, the user doesn’t want all the signal data for their analysis; instead they only want to identify time periods of interest within the signal. For example, perhaps the user needs handles to periods of time within the data for analysis defined by:
- Time period: by day, by shift, by Tuesdays, by weekdays versus weekends, etc.
- Asset state: on, off, warm up, shutdown, etc.
- A calculation: time periods when the second derivative of moving average is negative
- Data samples that are errors: lost signals, flyers, dropouts or other issues that require cleansing to improve analytics accuracy.
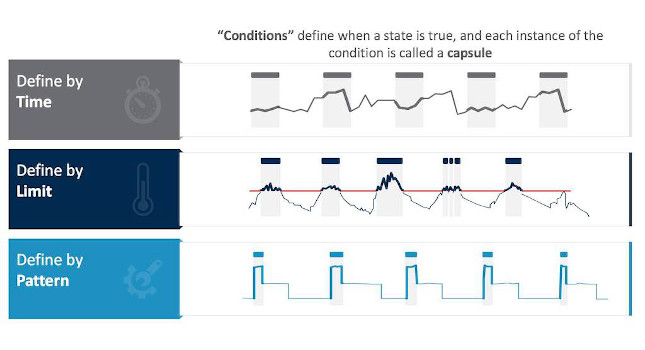
In other words, time periods of interest are when a defined condition is true, and the rest of the data can be ignored for the analysis. Time periods of interest may be selected to use as integration points with relational or discrete data types (see Figure 1).
Figure 2: Time periods of interest may be referred to as “capsules” and are marked by colored bars at the top of the trending pane. In this case, they denote areas that need to be addressed in a data-cleansing effort. Courtesy: Seeq[/caption]
Second, it is important to remember that any analysis of time-series data involves sampling of signal data with strict adherence to the challenges of interpolation and calculus, something that IT-data consolidation/aggregation efforts typically don’t address. Therefore, the use of manufacturing-specific solutions for contextualization are required. The ability to align signals with different sample rates from different data sources in different time zones spanning Daylight Saving Time or other changes is an absolute requirement prior to enabling definition of the relevant time periods.
Contextualization and the last mile
The final step of contextualization after identifying time periods of interest within time series signals is to then further contextualize data from other sources to enable insights that span manufacturing and business outcomes. The types of questions organizations may ask — all of which require the use of multiple, unlike data sets — may include:
- What is energy consumption when making Product Type 1 versus Product Type 2?
- What is the impact of temperature on product quality?
- Does power consumption change as batch completion time varies?
Data sources can include laboratory information systems, manufacturing execution systems, enterprise resource planning systems, external raw material pricing systems and others.
A case in point for contextualization within time series data and then across other data sources is shown in the following example. The result is a table, which is easy to understand and manipulate, accessible to SMEs and any analyst using a business intelligence application such as Microsoft Power BI, Tableau or Spotfire (see Figure 3).
Looking forward
There is ever more attention and pressure on industrial organizations to perform digital transformation, along with the required information technology/operational technology (IT/OT) integration necessary to provide an integrated view across business and production data sets. Therefore, it is increasingly important for manufacturing organizations to recognize the importance of contextualization, regardless of the selected storage strategy for their time-series data.
SMEs must perform contextualization to make data ready for analytics. Only the SMEs have the expertise and understands the needs of their analysis, and they will thus know what they are looking for right at analytics time. This includes the ability to rapidly define, assemble and work with the time periods of interest within time-series data, including access to related data in manufacturing, business, lab and other systems.
Therefore, organizations that align the contextualization requirements of time-series analytics with their data strategy will have a higher chance of improving production outcomes through insights.