Process engineers enabled with advanced analytics can have better operational control.
The speed at which vaccines for COVID-19 became available – from development to clinical trials to production is something the world has never seen. In a way, we were lucky to have had this happen in a time with so many scientific and digital advancements. Producing a vaccine for a global pandemic in less than a year is something that could not have been possible without digital technologies.
Many pharmaceutical companies have had to contend with complex process challenges while mass producing an effective and safe vaccine at a record pace. So now, when time is of the essence, vaccine producers can’t afford minor incidents along the production line, bad quality batches or unscheduled downtime due to failing equipment. Luckily, the rapid adoption of IIoT-enabled solutions like automated operations, process simulations and advanced data analytics have helped organizations become safer, more efficient and cost effective. When it comes to the production of something as critical as a vaccine, self-service advanced analytics in particular is a production and quality control game-changer.
Components of vaccine quality
When the pandemic hit, self-service analytics took center stage to help pharmaceutical companies ensure high standards for the COVID-19 vaccine were maintained. Quality for pharmaceutical manufacturers relates to the quality and performance attributes of the raw material used in the production process in addition to production line performance. Principal ingredients in producing Covid-19 vaccines comprise of water, adjuvants, preservatives/stabilizers, and the active ingredient (antigens), which contains residual inactive ingredients necessary to the actual production process. Equipment health, storage and shipment conditions, packaging, and handling are other key factors that could impact product quality.
During pharmaceutical production, it is good manufacturing practice to utilize a process control system (PCS) to maintain consistent levels of quality, cost, and capacity, while also ensuring worker safety. Another important component to ensuring product quality are self-service analytics, which can leverage process time-series data. Captured from sensors throughout the production line, self-service analytics can analyze time-series data to give experts process insights to improve operational performance and control product quality. Self-service analytics also allows for the integration of crucial batch information, which can be assessed and tracked for quality control purposes.
Quality assurance (QA) delivers confidence that quality standards are being upheld. Certain activities and actions can be performed to prevent quality problems by utilizing systematic measurement, comparisons with known standards, monitoring the production processes and variables, and establishing an associated feedback loop. The pH, temperature, and cycle time are key variables that should be monitored because they can affect quality. Sensor-generated time-series data of these variables should also be monitored.
Harnessing the power of advanced analytics
Data scientists have been using sensor-generated time-series data, which could include data from other sources as well, to create process monitoring and prediction models used to resolve complicated process challenges. This problem-solving approach is a time consuming and analytically demanding and requires experts in the field, so only the most critical process problems can feasibly be addressed.
However, process and subject matter experts (SMEs) are already conducting some data analytics on a daily basis through the studying, troubleshooting, and optimizing of their processes. Importing data from sensors and integrating contextual information from other sources often involves filtering out irrelevant periods and performing mathematical manipulations as well as calculating correlations. All of which is an iterative process. Similar to the approaches data scientists take, traditional approaches in process analyses tend to be extremely time-consuming. A thorough exploration that would take days, sometime even weeks, is often only for the most critical problems.
A more practical, effective approach is to allow SMEs to do more advanced analytics themselves, so they can leverage their process knowledge and time-series data to monitor, analyze, and predict industrial processes. An example of this approach is when SMEs used self-service advanced analytics to optimize COVID vaccine production.
SMEs were able to interpret the time-series data to uncover meaningful information regarding production processes at any given time. Data was easily visualized, and patterns easily recognized. In addition, the machine learning (ML) capabilities of the self-service analytics supported users allowing them to more quickly troubleshoot problems and optimize operations.
Eliminate data silos to further contribute to product and quality control
Advanced analytics further contributes to product and quality control by enabling SMEs to contextualize their data. During the production process, various events such as maintenance stops, process anomalies, asset health information, external events, and production losses can affect product quality and impact operational performance. Usually, this information is stored in different data silos within difference teams, which prevents data transparency. With self-service analytics, information for these events can be collected and recorded within the platform to provide one data source for all personnel and teams to gain additional insights into quality control and operational performance. Data silos are eliminated as a result.
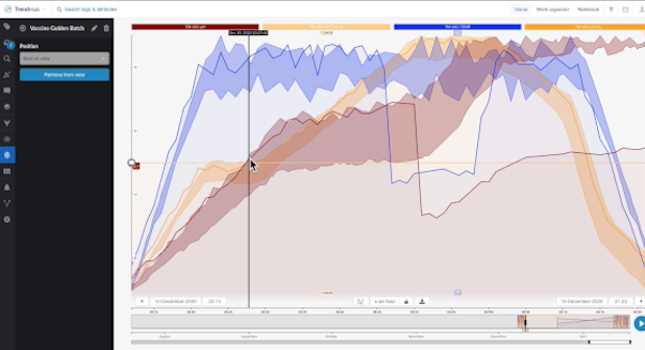
Fully leveraging context data can be instrumental. As seen with vaccine production, for example, every batch is comprised of its own metadata including the batch number, cycle time, compliance data, etc. – all of which can be extended to include the lab test data. Such information enables a more meaningful and quicker assessment of the best production runs. Process experts can then create a “golden batch fingerprint,” or a “good batch” benchmark that can be used for assessing future batches. The data of underperforming batches can be more readily determined and can serve as a reliable starting point for conducting an investigative analysis, which we will detail in the following use case.
Use case: Managing quality control issues in vaccine production
While COVID-19 vaccine production was underway, a pharmaceutical company’s team of process experts recognized an issue with the vaccine’s quality. It was evident they needed to drill down into the data to quickly determine the problem. They used a self-service analytics tool to view all details of production trends and other context process information. The analytics tool guided them through the vital steps within their investigative phases in order to fully understand what factors were affecting their batches in order to know what actions to take to resolve the quality issues in their vaccine production.
The Investigative phases they conducted were as follows:
Phase 1: Issue assessment
The team first ran a query to check out the batch data trends. The self-service analytics tool they used has the capability of providing a dashboard which contains tiles that are visual representations of important process data points. By reviewing the box-plot tile on the dashboard, the team saw the cycle time of a recent batch was much longer than normal. They were also able to determine some of the process phases had a higher variation than others.
Next, they checked the “current value” tiles within the dashboard and determined their overall process had been behaving within the expected control parameters. Lastly, looking for any inconsistency in the quality of the material, they drilled down into a tile’s data that contained contextual process information to view specific events and to search for batch inconsistencies. Even though there were different events occurring throughout the process, they were only interested in investigating the “Failed Batch” events, which represented the discrepancy in quality.
Phase 2: Root cause analysis
This phase constituted a root cause analysis in which process experts assessed the “failed batch” events to determine the cause of the lower quality batches. Since pH is a key driving factor in determining the final quality numbers, the team began with investigating this parameter. The team used the “recommendation engine,” which is a feature that uses ML to produce recommended solutions as well as answers to process questions. They learned a drop in temperature caused a drop in pH. Therefore, they believed it was plausible the temperature drop was likely the reason for the lower quality product.
By comparing the failed batch against a set of previously approved batches (saved as a “golden fingerprints”), they were able to pinpoint where the process deviated. They discovered the temperature dropped out of threshold, which was then followed by a pH drop out of threshold. All these findings supported their hypothesis of the cause of the batch failures.
Phase 3: Proactive measures
To prevent future deviations and keep their batches within the ideal thresholds, the team set up a monitor that could work in conjunction with the golden batch fingerprint. Thus, when any process deviation is detected, the self-service analytics tool will automatically send an email alert to personnel to notify them about the potential problem. This alert gives the team enough time to address the process issue and to prevent a bad batch from occurring.
Concluding thoughts
IIoT-enabled technology can deliver deeper insights into operations like never before. Thanks to self-service advanced analytics, critical pharmaceutical processes like COVID-19 vaccine production and other lifesaving medicines can now benefit from data-driven quality control and optimized production processing. It also means pharmaceutical companies can reduce production losses and costly setbacks due to production anomalies.
This is one example of how self-service analytics really delivers on its worth and drives process optimization. COVID-19 vaccinations are helping to save lives and to return life to normal. Without self-service analytics, vaccination production could never have met the targets needed to protect and save lives and get society back on track.
References
- Bloomberg COVID Vaccine Tracker
- British Society for Immunology
For more information, visit www.TrendMiner.com
