In a modern iOps center, pick your graphics and displays for optimum success
In the past, plant personnel had to live close to their job. Every aspect of plant operations was located at the plant site except for perhaps sales, marketing, and executive management. People today want to work where they live,
but not necessarily live where the work really is. Where the “job” is could be dangerous, dirty, and distant, and frankly the location could be just plain dull.
but not necessarily live where the work really is. Where the “job” is could be dangerous, dirty, and distant, and frankly the location could be just plain dull.
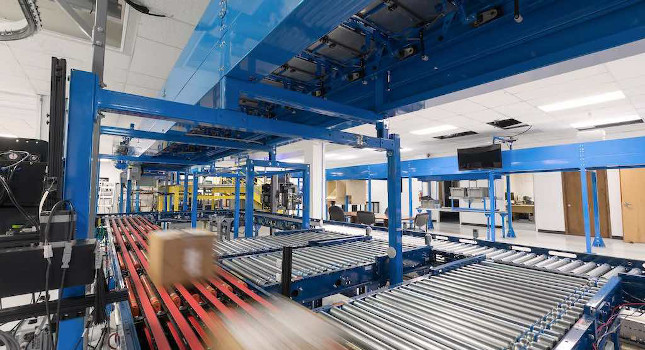
Today’s technology allows operations personnel to control the process from 50 ft or 500 miles away, allowing businesses to put control rooms, centralized maintenance, operations, and production engineering in more appealing locations where they can attract the most talented people.
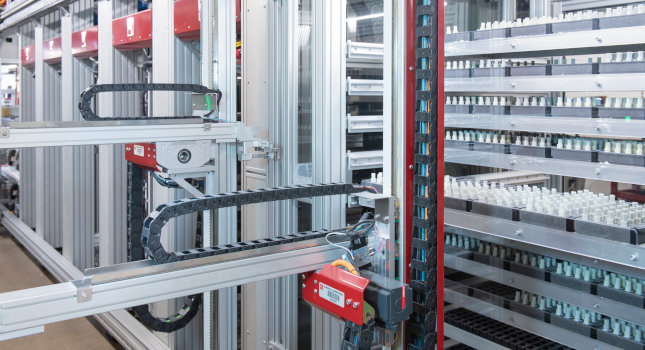
Developments in control technologies and field devices, along with robust networks, enable remote process monitoring and control. This new operations, maintenance, production, and collaboration center is now commonly called the Integrated Operations center, or iOps. Industries most commonly utilizing integrated operations are oil and gas, refining, power, and mining. These companies need to be able to track, display, and act upon a vast amount of information that’s vital to company operations. Information comes from multiple sources, both internal and external to the enterprise, and needs to be organized and presented in a manner that gives users situational awareness and the ability to make the best possible business decisions.
Engineering support can be readily supplied to a facility anywhere in the world directly from a command center. Personnel can remotely diagnose operations and equipment, all the way down to flowmeters and valve actuators, and specialized experts can solve problems worldwide.
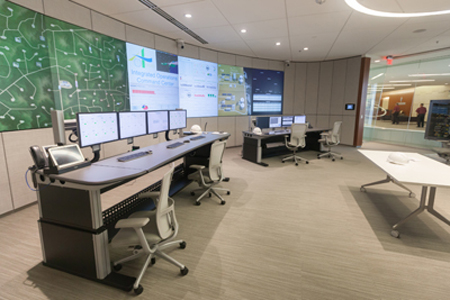
The iOps command center
An iOps command center is typically located in a central or convenient location that’s appealing to the people you need to have on hand to make optimal decisions quickly: engineers, control specialists, traders, maintenance planners, operators, safety personnel, security personnel, and others.
The Integrated Operations building normally houses offices, conference rooms, and a command center. A command center uses multiple display technologies, including large wall projection screens, monitors mounted on the wall or on a stand, tablets on desks, operator console displays, and smartphones. Questions for anyone designing a command center are: What types of display technology do I use, what graphics do I put on each display, and who uses these displays and graphics?
There are no standards organizations or industry best practices that govern the number of displays or the graphic content in command centers. Standards organizations such as ISA cover operations graphics, and the Manufacturing Enterprise Solutions Association covers maintenance graphics, but no one covers the hierarchy of graphics and the large amount of data coming into a command center. The Center for Operator Performance (COP) is another organization working in this area. It conducts training workshops to demonstrate methods to implement research findings and acts as a repository for human factors data in process control.
iOps graphic hierarchy
To support an iOps command center, Emerson has defined a graphic hierarchy consisting of three major types of graphics:
Analytical graphics: These are defined and developed based on the key decisions required for specific roles within a business. Examples of these roles include business executives, production engineers, and maintenance planners. These graphics show information used for analysis of business processes across the enterprise. The data could be in its native state, calculated to predict a future state, and/or combined with other data and then compared to a target value.
Information on these graphics is from department functional metrics to business key performance indicators (KPIs) in formats such as tables, trends, and bar and pie charts. KPI formats are used to quickly visualize large amounts of information. Analytical graphics have multiple information sources such as the ERP system, automation system, enterprise historian, accounting and production scheduling systems, and Internet information sites such as those showing real-time pricing data.
Situational awareness overview graphics: These display information within a plant operator’s domain of responsibility. This may be all the process units in a plant, or all the units associated with a process stream, such as a distillation column, a network of wells, or a pipeline. The main function of this overview graphic is to provide high-level situational awareness that enables an operator to determine if his or her overall domain of responsibility is operating as designed within four seconds.
The situational awareness overview graphics reside on displays that are typically a large display wall or monitors mounted above and behind the operator’s console. KPI visualization techniques are used to show the status of large amounts of current process data.
These overview graphics receive data primarily from sources such as automation systems, the safety system, and process historians. The picture below would not make sense in every industry. A refinery or chemical plant would not need a geospatial animated graphic but one showing major pieces of equipment in the process that would be in the operator’s domain of responsibility.
Operational process control graphics: The graphics on an operator’s console display have more detail than the situational awareness overview graphic and are typically presented only on process system console monitors. Operators and maintenance personnel use these graphics to monitor alarms, make process adjustments, and view the health of field instruments and equipment. These graphics are where the operator gathers detailed information to make a decision, and then takes action to change the process.
A process graphic is used to control the real-time operations of a specific unit within a facility, or a subset of assets under the control of a given operator. These graphics primarily receive information from the automation system and process historians.
Situational awareness overviews and process graphics allow several roles in a command center to make a process control decision that directly affects the business.
Determining the graphic hierarchy and the type and number of graphics and which display technology is needed for an iOps command center needs to be thought out and designed for the operation of the process and the business. But if the designers follow the guidelines of graphic hierarchy, graphic characteristics, and human-centered design, everyone in the command center will have access to all the information they need to do their jobs.
Roles
Roles define who uses the graphic. Business executives, managers in production, maintenance, safety, quality, and operations would all be users of analytical graphics. Analysis is performed and data is displayed in KPI format for current and performance measurements that several different types of managers would use to help direct their work tasks. For example, business analytics would help supply chain and production scheduling personnel run the enterprise more effectively by supplying them with calculations and forecasting for decision making.
Situational awareness overviews are generally for operations, the maintenance department, and production supervisors, who use these graphics to quickly understand the state of the process, maintenance activities, and real-time production data.
Process control graphics are more detailed and used by operators and maintenance personnel to control the process. They provide decision making support and allow the operator to manipulate the process to keep it running within design constraints while maximizing business results.
Scope
Scope relates to the overall function of the graphic. An analytical graphic shows an overview of the process or business. This involves information from multiple areas of the business, calculations, and predictions of a future state.
Examples are: projected inventories by the end of the month, monthly comparisons of work orders, current and projected pipeline capacities, well production, shipping schedules, customer orders, etc. From these actual reports compared to target overviews, users can drill down into specific and detailed analytical data.
The scope of a situational awareness overview graphic is defined by a given operator’s domain of control. This may be all the process units in a plant, or all systems associated with a process, such as a distillation column, a network of wells, or a pipeline. Information from the process control system is provided to give situational awareness of the operator’s area of responsibility.
A process graphic details the specific operation of a given unit or subset of assets. This is a smaller scope than a situational awareness overview graphic and allows for more detailed information to be presented.
Information sourcing
Information sourcing refers to the number of data sources connected to the graphic. Analytical graphics present a vast amount of information from multiple sources in the enterprise, such as ERP systems, production and inventory control software at several process units, and calculations to predict a future state. A high-level analytical graphic condenses this information for analytic purposes and enables personnel to navigate into specific and detailed information.
Information on a situational awareness overview graphic may be dense, but only involves specific information from a few sources: the process control system, the safety system, and the historian. The process control system and safety system provide real-time information for control, while the historian provides context to the operator to show the trajectory of operations.
Navigation
Analytical graphics are highly navigable. People in management positions may need to access a large number of different types of analytical graphics from their devices. Navigation might include sequential query capability, multi-level drill downs, etc. When setting up analytical graphics, it’s important to simplify the process of moving from one function to another, perhaps with drop-down menus, hot buttons, and icons.
Situational awareness overview graphics have limited navigational capabilities. Displayed information typically is in real time. There might be hot buttons to launch process control graphics on the operator’s console, but generally the situational awareness graphic is displayed continually. Anyone walking into the command center can see within a few seconds that a process is running within limits and any process alarms that are active, current production and possibly the status of maintenance activities in the field.
Navigation of process control graphics brings up detailed information on units, control loops, and the associated pieces of equipment such as a control valve or transmitter, as well as access to related process units.
IT requirements
All graphic types have IT requirements involving uptime, availability, and security.
Situational awareness overview graphics shown on a large display wall and process control graphics shown on operations consoles must have 100% uptime. Analytical graphics do not have to be 100% available because the operation can continue to operate safely when an analytical graphic is not available. Analytical information can be displayed on tablets, office PCs, or smartphones that are turned on and off regularly.
The defining characteristic of analytic graphics is secure connections to data sources on varied output devices (monitors, smartphones, tablets, etc.) from less secure networks outside the firewall. Situational awareness overview and process control graphics also need secure connections but inside the firewall.
Security policies need to be addressed on mobile devices as there will be proprietary company data inside the firewall. Data could be encrypted, or a VPN connection from the device to a company network may be required. There are different options to secure the data, based on the policies and requirements of the end user.
The 5 graphic characteristics:
The five main characteristics for analytical, situational awareness overview, and process graphics are:
- Roles
- Scope
- Information sourcing
- Navigation
- IT requirements
6 keys to a successful iOps center
An iOps command center encompasses six main attributes:
- Pervasive sensing: enables monitoring of data from process and non-process sensors throughout the enterprise. It is the foundation of the enterprise knowledge networks that apply not only to the process, but also to the business.
- Remote operations and remote monitoring: enables operators and engineers to remotely monitor and control a facility, improve process control, and solve problems.
- Integrated/centralized maintenance: enables maintenance personnel to diagnose equipment, write work orders, and use video to monitor procedures.
- Collaboration: enables maintenance, production, and business executives to collaborate with experts at another location, at any business unit throughout the enterprise, or with external, third-party experts.
- Production planning and optimization: enables personnel to plan and optimize production across the enterprise.
- Business operations: enables personnel to perform operational risk management, production accounting, enterprise performance management, and other tasks.
These attributes may be viewed as functions that increasingly add business value. A particular business may not implement every one of these functions, but instead only the attributes that add value to its type of business.