OEE: Using metrics to manage, improve performance
Overall equipment effectiveness has become one of the most popular manufacturing metrics in recent years. Plant and operations managers use OEE to measure performance at the machine, line and plant levels. Operational executives use OEE to set stretch objectives for the organization at the plant and enterprise levels.
Overall equipment effectiveness has become one of the most popular manufacturing metrics in recent years. Plant and operations managers use OEE to measure performance at the machine, line and plant levels. Operational executives use OEE to set stretch objectives for the organization at the plant and enterprise levels. CFOs are presenting the investment community with OEE goals for their company. “OEE is the number one metric that clients ask about,” said Colin Masson, research director at AMR Research.
But OEE has become more than just a measure of machine performance. “Many managers feel that OEE is the best tool for managing operations in the context of cost and efficiency focused manufacturing,” said Julie Fraser, principal at Industry Directions and lead analyst and author of the report “Metrics that Matter: Uncovering KPIs that Justify Operational Improvements.”
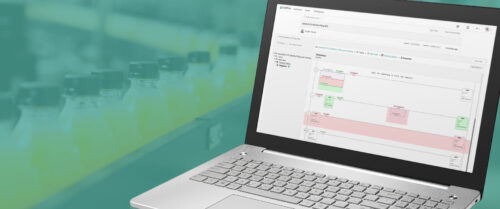
| Fig. 1. If the line was scheduled to produce 1,000 units per hour, then during a 10-hour shift, it should produce 10,000 units. At 53% OEE, only 5,300 units were produced. |
“With a manufacturing schedule that is accurate for customer demand, (OEE) in many ways becomes a measure for best achieving the conversion of manufacturing investment to margin dollars,” Fraser said.
At companies such as Rexam Beverage Can Company, OEE is more than just a metric. “We use OEE analysis to identify the line-flow problems, so we can level out the flow,” said David Wilke, manufacturing systems process manager and Six Sigma Master Black Belt. “As a result, we get much more throughput, and less spoilage and downtime because we are not stopping and starting all of the time.”
Unfortunately, OEE is easier to spell than to measure. Many companies don’t get the full benefit of measuring OEE in their operations because they don’t measure it accurately and they don’t provide their people with tools for identifying improvements. The result is often another management-driven initiative that dies away slowly (often at the hands of the people being measured).
Defining OEE
In its simplest form, OEE is a measure of efficiency of an asset or group of assets. If a packaging line has an OEE of 53%, it means that 47% of the time the asset was not productive. But, what does that mean?
The truth is most people don’t know. Low OEE can be the result of many different losses during the day, such as unplanned downtime, changeovers, dwell time, material shortages, operator intervention, misfeeds, scrap and who knows what else, but it can add up to significant losses. Even companies that measure OEE accurately for each shift rarely have a detailed understanding of their losses. But companies that measure accurately and focus on the underlying reasons for the loss are making unprecedented performance improvements. “Our OEE analysis tools are helping us to identify huge opportunities,” said Wilke. “We can focus our attention on where to drive the most performance improvement.”
By itself, OEE is just another number. In order to make real improvements in performance, OEE must be measured and analyzed by the people running the operation, with training and tools for identifying losses.
Measuring OEE
The simplest way to measure OEE is to measure the equipment output for a period of planned production time, and then calculate how much product should have been produced at the machine’s rated speed (see “Rated speed”). OEE is a ratio of these numbers:
Using this simple method provides an accurate benchmark for performance and can help identify poorly performing assets. However it does not provide the user with any information about the source of the losses, leaving a lot of guesswork as to how to improve performance (Fig. 1).
A more useful method for measuring OEE is the traditional definition as a product of three sub-measures:
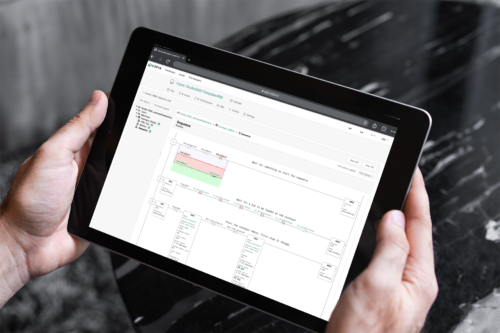
| Fig. 2. Calculating OEE using its three subcomponents: availability, performance and quality, requires more information, but it is a more useful method of measuring OEE because it provides more detail for analysis. |
This method of calculating OEE requires more information, but it also provides more detail for analysis (Fig. 2).
Availability is a percentage of time that an asset is ‘available’ for production. This is the time that the asset is actually running divided by the time it is planned to be in production. Equipment failures, changeovers and material shortages can stop a machine and reduce the amount of available time. To calculate availability, you must keep an accurate record of start and stop times during planned production.
Quality is defined as the percentage of time that a machine produced ‘quality’ products while it was available. Quality losses include products that require rework, material rejected from the machine and products that do not meet quality standards. To measure quality, you should keep an accurate record of scrap that is produced during planned production.
Performance is a ratio that measures a machine’s ability to perform at its rated speed. Operator abilities, machine wear, raw material quality, misfeeds, frequent stops and adjustments decrease machine performance. Performance losses often become a ‘catch-all’ for losses that are unclassified or immeasurable, and are typically the most difficult to measure because of the frequency and variety of losses.
Don’t get too hung up on classification. Many events are difficult to classify and subjective in nature such as brief downtime due to starvation at a machine. This could be classified as material starvation — an availability loss, or downtime due to line flow problems — a performance loss. Either way, the most important aspect is that the loss event is captured in detail so that it can be analyzed. Use your own circumstances and the recommendations of your continuous improvement program (Lean, Six Sigma, TPM, etc.) to decide how to classify your losses (Fig. 3).
The trick to using OEE to drive performance improvements is to detect and classify every loss, accounting for every minute of production. This can be difficult.
OEE data collection, analysis
The ultimate goal of OEE analysis is the ability to understand every loss, where it came from and why it occurred.
Detailed analysis like this requires a method for accounting for every minute of operation. Events such as breakdowns and operator stops get recorded as they occur — either manually (written down by the operator) or automatically from the machine controller. Some events happen so quickly, though, that it is not possible or feasible to record them manually. Many companies ignore these events, focusing on long duration events instead. While this is a reasonable strategy initially, problems such as misfeeds, material starvation or backup on the line can result in significant losses, but would only be identified with automated data collection. Today, most events can be automatically logged using appropriate hardware and software.
Automatically collected data is not only more detailed, it is typically more accurate than manually collected data. Today, using systems that incorporate standards such as OPC and ISA-95, collecting and organizing data has never been easier. Reckitt Benckiser’s Springfield, MO, plant, maker of French’s Mustard and the world’s largest mustard manufacturing plant, has gone to great lengths to accurately collect OEE data. According to operations manager Rhys Roberts, “We consider breakdowns, changeovers, minor stops and transient losses all part of our downtime analysis. Our goal is to identify the biggest opportunities for increasing availability, and detailed data collection is required.”
Reckitt Benckiser’s OEE solution uses OPC extensively to collect machine data, and a database, modeled on ISA-95 standards, to store and organize the data. But they still need more data. Like most manufacturers today, Reckitt Benckiser runs a complex work schedule, multiple products per line and frequent changeovers per shift. “There is no such thing as a rated speed per line,” said Charles Riley, productivity manager at the plant. “OEE was chosen as a metric because it can be applied to compare performance of different [manufacturing] technologies, various products and rated speeds and complex scheduling environments.”
In order to accurately measure OEE in this complex environment, Reckitt Benckiser also collects data about work schedules, products and even operator breaks, lunches and meetings in order to accurately measure OEE.
| Fig. 3. Although it is difficult, the trick to using OEE to drive performance improvements is to detect and classify every loss, accounting for every minute of production. |
Keeping it in perspective
OEE is a measure of efficiency — not a measure of profitability. While it is true that some of the most profitable companies are also the most efficient, you can’t make every corporate decision based on OEE.
Think of OEE as a lever for profitability. It can be more profitable to run a product with a high profit margin and low OEE than a product with a low profit margin and high OEE. Improving OEE just a little on a line with a high-margin product can produce more profits for the company than improving OEE more significantly on a line with a low-margin product.
OEE is a valuable metric for measuring asset performance and driving improvements that provide companies with lower costs, greater flexibility and higher profits. More than just a measure of performance, OEE can be an extremely valuable analysis tool when high-resolution OEE data is collected and careful analysis is used to identify improvements. Companies that consistently use OEE to measure and analyze performance across the enterprise are achieving best-in-class results, and returning significant profits to their shareholders.
| Author Information |
| David L. Brochu is executive vice-president of Acumence, LLC in Chicago. Acumence is a provider of manufacturing business intelligence software solutions for high-volume manufacturing and packaging firms. |
The Six Big Losses?
The Six Big Losses are simply another way to classify loss events — creating another level of detail beyond availability, performance and quality losses. Generally speaking, these six loss categories are typical of the ‘big’ losses seen by manufacturers:
| 1 | Breakdowns | Availability loss |
| 2 | Setups and adjustments | Availability loss |
| 3 | Small stops | Performance loss |
| 4 | Reduced speed | Performance loss |
| 5 | Startup rejects | Quality loss |
| 6 | Production rejects | Quality loss |
Rated speed
A machine’s rated speed, in units-per-hour, is the speed at which it is meant to operate when in good working condition, for the product being produced. Some machines operate at only one rated speed, but many machines can vary speed. For example, the rated speed of an injection molding machine will change based on the number of molds and the material being molded.
When there are multiple machines on a line, the rated speed of the line is typically set at the rated speed of the ‘bottleneck’ machine — the slowest machine on the line.
Do you have experience and expertise with the topics mentioned in this content? You should consider contributing to our CFE Media editorial team and getting the recognition you and your company deserve. Click here to start this process.